

MannKind Reports Second Quarter 2026 Financial Results and Provides Business Update
- Achieved three major catalysts to drive future growth:
- Launched the pediatric indication of Afrezza® following FDA approval
- FUROSCIX ReadyFlow™ autoinjector approved for treatment of edema in HF and CKD
- Positive nintedanib DPI Phase 1b data in IPF patients validates continued Phase 2 advancement
- Encouraging early momentum in Afrezza pediatric launch
- 1 in 3 of the top 100 pediatric insulin writers have prescribed
- Q2 2026 total revenues of
$109.4M , +43% vs. Q2 2025 - Conference call and webcast today at
4:30 p.m. ET
a biopharmaceutical company dedicated to transforming chronic disease care through innovative, patient-centric solutions for cardiometabolic and orphan lung diseases, today reported financial results for the second quarter of 2026, and provided a business update.
“This was a transformative period for
Business Update and Upcoming Milestones
Commercial Products
- Revenue from marketed products (Afrezza, Furoscix®) grew 27% from Q1 2026 to Q2 2026
Furoscix
- Furoscix (furosemide injection) generated
$22.2 million in net sales for Q2 2026 - Continued growth in Integrated Delivery Networks, increasing doses purchased by 36% over Q1 2026
- Record number of nephrology units dispensed, increasing by 67% over Q1 2026
- Received FDA approval of Furoscix ReadyFlow™ on
July 23, 2026 , the first and only autoinjector delivering IV-equivalent diuretic therapy for the treatment of edema in adults with heart failure (HF) or chronic kidney disease (CKD); expected to be commercially available in late August
Afrezza
- Afrezza (insulin human) Inhalation Powder generated
$17.0 million in net sales for Q2 2026 - Received FDA approval of Afrezza on
May 29, 2026 for use in children and adolescents ages 6 and older living with diabetes - Awarded
Breakthrough T1D grant supporting advancement of INHALE-1ST, a pediatric trial of Afrezza in youth with newly diagnosed type 1 diabetes
Development
Nintedanib DPI (MNKD-201)
- Topline data readout of
U.S . Phase 1b INFLO-1 demonstrates safety and tolerability in IPF patients - Site activation and enrollment underway in the global Phase 2 INFLO-2 study
Ralinepag DPI (MNKD-1501)
- On track for IND filing by year end
- Received a
$5 million payment from United Therapeutics (UT) to support the rapid advancement of ralinepag DPI
Corporate Update
- Cash, cash equivalents and investments as of
June 30, 2026 , totaled$111 million - Closed
$50 million private placement onJuly 24, 2026 ; proceeds will fund the$45 million CVR payment triggered by the FDA approval of Furoscix ReadyFlow
Second Quarter 2026 Financial Results
Revenues
| Three Months Ended |
||||||||||||||||
| 2026 | 2025 | $ Change | % Change | |||||||||||||
| Revenues | (Dollars in thousands) | |||||||||||||||
| Afrezza | 17,021 | 18,329 | (1,308 | ) | (7 | %) | ||||||||||
| Furoscix | 22,191 | — | 22,191 | N/A | ||||||||||||
| V-Go® | 2,770 | 4,125 | (1,355 | ) | (33 | %) | ||||||||||
| Collaborations and services | 35,022 | 22,845 | 12,177 | 53 | % | |||||||||||
| Royalties | 32,370 | 31,228 | 1,142 | 4 | % | |||||||||||
| Total revenues | $ | 109,374 | $ | 76,527 | $ | 32,847 | 43 | % | ||||||||
Total revenues for the second quarter of 2026 increased compared to the same period in the prior year due to the addition of Furoscix to our product portfolio through the
Operating Expenses and Other Financial Highlights
- Cost of goods sold – commercial, excluding amortization of acquired intangible assets, was
$14.4 million for the three months endedJune 30, 2026 , compared to$4.6 million for the same period in 2025.- The increase is primarily attributable to the inclusion of Furoscix into our product portfolio following the acquisition of scPharma in
October 2025 . Gross margin percentage decreased in the current period due to the inclusion of Furoscix, which has a lower gross margin percentage than Afrezza.
- The increase is primarily attributable to the inclusion of Furoscix into our product portfolio following the acquisition of scPharma in
- Research and development expenses were
$18.0 million for the three months endedJune 30, 2026 , compared to$13.7 million for the same period in 2025, an increase of 32%.- The increase was primarily attributable to the development of the Furoscix ReadyFlow Formulation as well as higher personnel costs following the acquisition of scPharma and increased development costs for MNKD-201, which has begun enrolling subjects. The increase was partially offset by lower clinical development expenses resulting from the discontinuation of the ICoN-1 clinical study for MNKD-101 and the completion of the Afrezza pediatric study (INHALE-1).
- Selling, general and administrative expenses were
$58.3 million for the three months endedJune 30, 2026 , compared to$31.6 million for the same period in 2025, an increase of 84%.- The increase was primarily related to costs associated with the promotion and support of Furoscix, as well as expanding our field-based teams and activities to support the launches associated with the recent approvals of the pediatric indication for Afrezza and the Furoscix ReadyFlow Autoinjector.
Six Months Ended
Revenues
| Six Months Ended |
||||||||||||||||
| 2026 | 2025 | $ Change | % Change | |||||||||||||
| Revenues | (Dollars in thousands) | |||||||||||||||
| Afrezza | 32,294 | 33,216 | (922 | ) | (3 | %) | ||||||||||
| Furoscix | 37,684 | — | 37,684 | N/A | ||||||||||||
| V-Go | 5,911 | 8,211 | (2,300 | ) | (28 | %) | ||||||||||
| Collaborations and services | 58,536 | 52,221 | 6,315 | 12 | % | |||||||||||
| Royalties | 65,119 | 61,233 | 3,886 | 6 | % | |||||||||||
| Total revenues | $ | 199,544 | $ | 154,881 | $ | 44,663 | 29 | % | ||||||||
Total revenues for the six months ended
Operating Expenses and Other Financial Highlights
- Cost of goods sold – commercial, excluding amortization of acquired intangible assets, was
$21.9 million for the six months endedJune 30, 2026 , compared to$8.4 million for the same period in 2025.- The increase is primarily attributable to the inclusion of Furoscix into our product portfolio following the acquisition of scPharma in
October 2025 . Gross margin percentage decreased in the current period due to the inclusion of Furoscix, which has a lower gross margin percentage than Afrezza.
- The increase is primarily attributable to the inclusion of Furoscix into our product portfolio following the acquisition of scPharma in
- Research and development expenses were
$35.2 million for the six months endedJune 30, 2026 , compared to$24.7 million for the same period in 2025, an increase of 43%.- The increase was primarily attributable to the development of the Furoscix ReadyFlow Formulation as well as higher personnel costs following the acquisition of scPharma and increased development costs for MNKD-201, which has begun enrolling subjects. The increase was partially offset by lower clinical development expenses resulting from the discontinuation of the ICoN-1 clinical study for MNKD-101 and the completion of the Afrezza pediatric study (INHALE-1).
- Selling, general and administrative expenses were
$112.4 million for the six months endedJune 30, 2026 , compared to$56.6 million for the same period in 2025, an increase of 98%.- The increase was primarily related to costs associated with the promotion and support of Furoscix, as well as expanding our field-based teams and activities to support the launches associated with the recent approvals of the pediatric indication for Afrezza and the Furoscix ReadyFlow Autoinjector.
Conference Call and Webcast
About
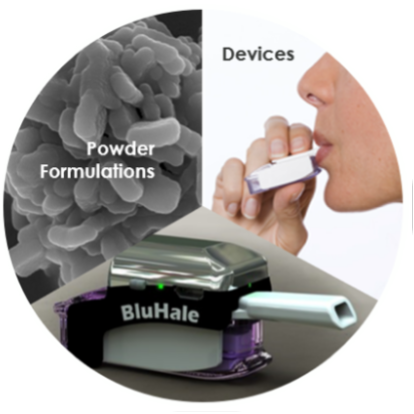
With deep expertise in drug-device combinations,
Learn more at mannkindcorp.com.
Forward-Looking Statements
Statements in this press release that are not statements of historical fact are forward-looking statements that involve risks and uncertainties. These statements include, without limitation, statements regarding the timing for expected commercial availability of Furoscix ReadyFlow and the broadened growth potential for Furoscix; the timing of a planned IND filing of ralinepag DPI; expectations regarding MannKind’s ongoing and planned clinical trials and nonclinical studies; and our being positioned for sustainable growth. Words such as “believes,” “anticipates,” “plans,” “expects,” “intend,” “will,” “goal,” “potential,” “prepare,” “opportunity” and similar expressions are intended to identify forward-looking statements. These forward-looking statements are based upon MannKind’s current expectations. Actual results and the timing of events could differ materially from those anticipated in such forward-looking statements as a result of various risks and uncertainties, which include, without limitation, risks associated with developing product candidates; risks and uncertainties related to unforeseen delays that may impact the timing of clinical trials and reporting data; risks associated with safety and other complications of our products and product candidates; risks associated with the regulatory review process; risks associated with competition; manufacturing risks; market adoption risks; and other risks detailed in MannKind’s filings with the Securities and Exchange Commission (“SEC”), including under the “Risk Factors” heading of its Quarterly Report on Form 10-Q for the quarter ended June 30, 2026, being filed with the SEC later today. You are cautioned not to place undue reliance on these forward-looking statements, which speak only as of the date of this press release. All forward-looking statements are qualified in their entirety by this cautionary statement, and MannKind undertakes no obligation to revise or update any forward-looking statements to reflect events or circumstances after the date of this press release.
Tyvaso DPI is a trademark of United Therapeutics Corporation.
AFREZZA, FUROSCIX, FUROSCIX READYFLOW, MANNKIND, and V-GO are trademarks of MannKind Corporation.
CONSOLIDATED STATEMENTS OF OPERATIONS |
||||||||||||||||
| Three Months Ended |
Six Months Ended |
|||||||||||||||
| 2026 | 2025 | 2026 | 2025 | |||||||||||||
| (In thousands except per share data) | ||||||||||||||||
| Revenues: | ||||||||||||||||
| Commercial product sales | $ | 41,982 | $ | 22,454 | $ | 75,889 | $ | 41,427 | ||||||||
| Collaborations and services | 35,022 | 22,845 | 58,536 | 52,221 | ||||||||||||
| Royalties | 32,370 | 31,228 | 65,119 | 61,233 | ||||||||||||
| Total revenues | 109,374 | 76,527 | 199,544 | 154,881 | ||||||||||||
| Expenses: | ||||||||||||||||
| Cost of goods sold – commercial, excluding amortization of acquired intangible assets | 14,409 | 4,607 | 21,917 | 8,375 | ||||||||||||
| Cost of revenue – collaborations and services | 15,131 | 15,961 | 25,094 | 29,709 | ||||||||||||
| Research and development | 18,001 | 13,675 | 35,232 | 24,697 | ||||||||||||
| Selling, general and administrative | 58,302 | 31,622 | 112,389 | 56,636 | ||||||||||||
| Amortization of acquired intangible assets | 4,367 | — | 8,734 | — | ||||||||||||
| (Gain) loss on foreign currency transaction | (486 | ) | 5,363 | (1,804 | ) | 7,872 | ||||||||||
| Total expenses | 109,724 | 71,228 | 201,562 | 127,289 | ||||||||||||
| (Loss) income from operations | (350 | ) | 5,299 | (2,018 | ) | 27,592 | ||||||||||
| Other income (expense): | ||||||||||||||||
| Interest income, net | 1,022 | 1,832 | 2,452 | 3,788 | ||||||||||||
| Interest expense | (11,894 | ) | (285 | ) | (19,372 | ) | (4,930 | ) | ||||||||
| Interest expense on liability for sale of future royalties | (510 | ) | (3,473 | ) | (3,073 | ) | (7,050 | ) | ||||||||
| Interest expense on financing liability | (2,414 | ) | (2,433 | ) | (4,807 | ) | (4,843 | ) | ||||||||
| Loss on settlement of debt | — | — | (917 | ) | — | |||||||||||
| Other expense | (4,992 | ) | — | (7,769 | ) | — | ||||||||||
| Total other expense | (18,788 | ) | (4,359 | ) | (33,486 | ) | (13,035 | ) | ||||||||
| (Loss) income before income tax (benefit) expense | (19,138 | ) | 940 | (35,504 | ) | 14,557 | ||||||||||
| Income tax (benefit) expense | (106 | ) | 272 | 147 | 731 | |||||||||||
| Net (loss) income | $ | (19,032 | ) | $ | 668 | $ | (35,651 | ) | $ | 13,826 | ||||||
| Net (loss) income per share – basic | $ | (0.06 | ) | $ | 0.00 | $ | (0.12 | ) | $ | 0.05 | ||||||
| Weighted average shares used to compute net (loss) income per share – basic |
309,191 | 304,954 | 308,732 | 304,222 | ||||||||||||
| Net (loss) income per share – diluted | $ | (0.06 | ) | $ | 0.00 | $ | (0.12 | ) | $ | 0.04 | ||||||
| Weighted average shares used to compute net (loss) income per share – diluted |
309,191 | 311,484 | 308,732 | 312,381 | ||||||||||||
| MANNKIND CORPORATION AND SUBSIDIARIES CONSOLIDATED BALANCE SHEETS |
||||||||
| (In thousands except share and per share data) |
||||||||
| ASSETS | ||||||||
| Current assets: | ||||||||
| Cash and cash equivalents | $ | 52,929 | $ | 74,882 | ||||
| Short-term investments | 58,201 | 96,464 | ||||||
| Accounts receivable, net | 43,207 | 38,367 | ||||||
| Inventory | 44,419 | 35,313 | ||||||
| Prepaid expenses and other current assets | 46,956 | 46,553 | ||||||
| Total current assets | 245,712 | 291,579 | ||||||
| Restricted cash | 749 | 745 | ||||||
| Long-term investments | — | 5,012 | ||||||
| Property and equipment, net | 85,160 | 82,423 | ||||||
| 67,595 | 67,595 | |||||||
| Developed technology - on-body infusor | 181,389 | 190,027 | ||||||
| IPR&D - ReadyFlow Formulation | 129,600 | 129,600 | ||||||
| Other intangible assets | 4,976 | 5,072 | ||||||
| Other assets | 17,123 | 20,129 | ||||||
| Total assets | $ | 732,304 | $ | 792,182 | ||||
| LIABILITIES AND STOCKHOLDERS' DEFICIT | ||||||||
| Current liabilities: | ||||||||
| Accounts payable | $ | 11,042 | $ | 9,034 | ||||
| Accrued expenses and other current liabilities | 60,768 | 64,628 | ||||||
| Senior convertible notes – current | — | 36,280 | ||||||
| Liability for sale of future royalties – current | 14,292 | 14,298 | ||||||
| Contingent consideration – current | 34,015 | 21,132 | ||||||
| Financing liability – current | 10,486 | 10,328 | ||||||
| Deferred revenue – current | 11,085 | 15,331 | ||||||
| Recognized loss on purchase commitments – current | 1,210 | — | ||||||
| Total current liabilities | 142,898 | 171,031 | ||||||
| Liability for sale of future royalties – long term | 133,552 | 136,985 | ||||||
| Financing liability – long term | 92,497 | 93,092 | ||||||
| Deferred revenue – long term | 36,857 | 39,977 | ||||||
| Recognized loss on purchase commitments – long term | 62,922 | 65,952 | ||||||
| Operating lease liability | 9,687 | 10,689 | ||||||
| Contingent consideration – long term | — | 5,114 | ||||||
| Milestone liabilities | 2,003 | 2,003 | ||||||
| Term loan | 319,085 | 318,361 | ||||||
| Total liabilities | 799,501 | 843,204 | ||||||
| Commitments and contingencies | ||||||||
| Stockholders' deficit: | ||||||||
| Undesignated preferred stock, no shares issued or outstanding as of |
— | — | ||||||
| Common stock, 309,911,682 and 307,832,587 shares issued and outstanding as of |
3,099 | 3,078 | ||||||
| Additional paid-in capital | 3,161,330 | 3,141,741 | ||||||
| Accumulated other comprehensive (loss) income | (19 | ) | 115 | |||||
| Accumulated deficit | (3,231,607 | ) | (3,195,956 | ) | ||||
| Total stockholders' deficit | (67,197 | ) | (51,022 | ) | ||||
| Total liabilities and stockholders' deficit | $ | 732,304 | $ | 792,182 | ||||
Non-GAAP Measures
To supplement our condensed consolidated financial statements presented under GAAP, we are presenting non-GAAP net (loss) income and non-GAAP net (loss) income per share – basic, which are non-GAAP financial measures. We are providing these non-GAAP financial measures to disclose additional information to facilitate the comparison of past and present operations, and they are among the indicators management uses as a basis for evaluating our financial performance. We believe that these non-GAAP financial measures, when considered together with our GAAP financial results, provide management and investors with an additional understanding of our business operating results, including underlying trends.
These non-GAAP financial measures are not meant to be considered in isolation or as a substitute for comparable GAAP measures; should be read in conjunction with our condensed consolidated financial statements prepared in accordance with GAAP; have no standardized meaning prescribed by GAAP; and are not prepared under any comprehensive set of accounting rules or principles. In addition, from time to time in the future there may be other items that we may exclude for purposes of our non-GAAP financial measures; and we may in the future
cease to exclude items that we have historically excluded for purposes of our non-GAAP financial measures. Likewise, we may determine to modify the nature of adjustments to arrive at our non-GAAP financial measures. Because of the non-standardized definitions of non- GAAP financial measures, the non-GAAP financial measures as used by us in this report have limits in their usefulness to investors and may be calculated differently from, and therefore may not be directly comparable to, similarly titled measures used by other companies.
The following table reconciles our financial measures for net (loss) income and net (loss) income per share ("EPS") for basic weighted average shares as reported in our condensed consolidated statement of operations to a non-GAAP presentation:
| Three Months Ended |
Six Months Ended |
||||||||||||||||||||||||||||||||||
| 2026 | 2025 | 2026 | 2025 | ||||||||||||||||||||||||||||||||
| Net Loss | Basic EPS | Net Income | Basic EPS | Net Loss | Basic EPS | Net Income | Basic EPS | ||||||||||||||||||||||||||||
| GAAP reported net (loss) income | $ | (19,032 | ) | $ | (0.06 | ) | $ | 668 | $ | 0.00 | $ | (35,651 | ) | $ | (0.12 | ) | $ | 13,826 | $ | 0.05 | |||||||||||||||
| Non-GAAP adjustments: | |||||||||||||||||||||||||||||||||||
| Stock compensation | 10,226 | 0.03 | 7,520 | 0.03 | 16,681 | 0.05 | 12,905 | 0.04 | |||||||||||||||||||||||||||
| Interest expense on liability for sale of future royalties | 510 | 0.00 | 3,473 | 0.01 | 3,073 | 0.01 | 7,050 | 0.02 | |||||||||||||||||||||||||||
| Sold portion of royalty revenue(1) | (3,237 | ) | (0.01 | ) | (3,123 | ) | (0.01 | ) | (6,512 | ) | (0.02 | ) | (6,123 | ) | (0.02 | ) | |||||||||||||||||||
| (Gain) loss on foreign currency transaction | (486 | ) | 0.00 | 5,363 | 0.02 | (1,804 | ) | (0.01 | ) | 7,872 | 0.03 | ||||||||||||||||||||||||
| Amortization of intangible assets acquired | 4,367 | 0.01 | — | — | 8,734 | 0.03 | — | — | |||||||||||||||||||||||||||
| Change in fair value of contingent consideration | 4,992 | 0.02 | — | — | 7,769 | 0.03 | — | — | |||||||||||||||||||||||||||
| Loss on settlement of debt | — | — | — | — | 917 | 0.00 | — | — | |||||||||||||||||||||||||||
| Non-GAAP adjusted net (loss) income | $ | (2,660 | ) | $ | (0.01 | ) | $ | 13,901 | $ | 0.05 | $ | (6,793 | ) | $ | (0.03 | ) | $ | 35,530 | $ | 0.12 | |||||||||||||||
| Weighted average shares used to compute net (loss) income per share – basic | 309,191 | 304,954 | 308,732 | 304,222 | |||||||||||||||||||||||||||||||
| (1) Represents the non-cash portion of the 1% royalty on net sales of Tyvaso DPI earned during the three and six months ended |
|||||||||||||||||||||||||||||||||||

MannKind Contacts: Investor RelationsKate Miranda Email: ir@mnkd.com Media RelationsChristie Iacangelo Email: media@mnkd.com

Source: MannKind