Conference Call to Begin Today at 5:00 p.m. (ET)
- Tyvaso DPI™ approved by the FDA in May representing the second FDA-approved product using the Technosphere® inhalation platform
- V-Go® acquired May 31; $2.1 million Net Revenue recognized for June
- 2Q 2022 Commercial Products Net Revenue of $12.7 million; +28% vs. 2Q 2021
- 2Q 2022 Collaboration and Services Revenue of $5.9 million; +171% vs. 1Q 2022
DANBURY, Conn. and WESTLAKE VILLAGE, Calif., Aug. 09, 2022 (GLOBE NEWSWIRE) -- MannKind Corporation (Nasdaq: MNKD) today reported financial results for the second quarter and first half of 2022.
“In the second quarter, we achieved multiple milestones that position the Company for growth over the next decade,” said Michael Castagna, PharmD, Chief Executive Officer of MannKind Corporation. “Tyvaso DPI was approved by the FDA, which allowed us to recognize manufacturing and royalty revenues for the first time this quarter. We also generated revenue from a newly acquired product, V-Go, that is complementary to our endocrine franchise.”
Second Quarter 2022 Results
Total revenues were $18.9 million for the second quarter of 2022, reflecting Afrezza® net revenue of $10.6 million, V-Go net revenue of $2.1 million, collaborations and services revenue of $5.9 million, and royalties of $0.3 million. Afrezza net revenue increased 7% compared to $10.0 million in the second quarter of 2021 as a result of increased price, which included more favorable gross-to-net deductions, and patient demand which was substantially offset by wholesaler inventory ordering patterns that resulted in lower inventory levels for the second quarter of 2022. Collaborations and services revenue decreased $7.4 million compared to the second quarter of 2021 primarily due to the completion of the R&D Services associated with our collaboration with United Therapeutics (“UT”) in the second half of 2021. In August 2021, we entered into a commercial supply agreement (“CSA”) with UT. Revenue associated with the CSA was deferred until commercial product was manufactured and sold to UT, which occurred in the second quarter of 2022 when $4.7 million of revenue was recognized. The deferred revenue balance associated with the CSA increased by $4.1 million in the second quarter to $29.8 million as of June 30, 2022. The increase in deferred revenue was associated with the production of commercial product not yet sold to UT and services associated with the Tyvaso DPI production capacity expansion.
Afrezza gross profit for the second quarter of 2022 was $7.3 million compared to $5.6 million in the same period of 2021, an increase of $1.7 million, or 31%, which was driven by an increase in Afrezza sales and a decrease in cost of goods sold. Afrezza’s cost of goods sold decreased by $1.0 million, or 24%, compared to the same period in 2021, primarily attributable to a $2.0 million fee for the amendment of the Insulin Supply Agreement in the prior year period, partially offset by a $1.1 million increase in costs capitalized to inventory due to the timing of production between quarters. Afrezza gross margin in the second quarter of 2022 was 68% compared to 56% for the same period in 2021. V-Go gross profit for the second quarter of 2022 was $0.8 million.
Cost of revenue – collaborations and services in the second quarter of 2022 was $8.3 million compared to $5.5 million for the same period in 2021, an increase of $2.8 million, primarily due to an increase in manufacturing activities for commercial product manufacturing in the second quarter of 2022.
Research and development expenses for the second quarter of 2022 were $4.9 million compared to $2.3 million for the second quarter of 2021. This $2.6 million increase was mainly related to costs incurred for development activities on our product pipeline and the Afrezza pediatrics clinical study (INHALE-1).
Selling, general and administrative expenses for the second quarter of 2022 were $26.0 million compared to $20.0 million for the second quarter of 2021. This $6.0 million increase was primarily attributable to an Afrezza pilot promotional effort aimed at primary care physicians that began in Q4 2021, elimination of the Thyquidity co-promotion (which permitted some expenses associated with the sales force to be recognized as cost of revenue — collaborations and services in 2Q 2021), promotional expenses to support Afrezza growth, V-Go promotional efforts and higher stock-based and other compensation for G&A employees partially offset by lower personnel related costs offset due to Afrezza territory restructuring.
For the second quarter of 2022, the gain on foreign currency translation (for insulin purchase commitments denominated in Euros) was $4.5 million compared to a loss of $0.9 million for the second quarter of 2021. The fluctuation was due to a change in the U.S. dollar to Euro foreign currency exchange rate.
Interest expense on financing liability was $2.4 million for the second quarter of 2022, representing interest incurred on the November 2021 sale and lease-back of our manufacturing facility in Danbury, CT.
Interest expense on notes for the second quarter of 2022 was $6.6 million compared to $3.2 million for the second quarter of 2021. This increase of $3.4 million was primarily due to a $3.9 million increase due to a milestone rights obligation that occurred during the second quarter of 2022 and will be paid in the third quarter. Mann Group converted $10.0 million of debt and capitalized interest into common stock during the second quarter.
The net loss for the second quarter of 2022 was $29.0 million, or $0.11 per share, compared to $35.5 million in the second quarter of 2021, or $0.14 per share. The $6.5 million decrease in the net loss was primarily due to a loss on extinguishment of debt of $22.1 million in the second quarter of 2021 partially offset by lower collaboration and service revenue and an increase in operating expenses.
First half of 2022
Total revenues were $30.9 million for the first half of 2022, reflecting Afrezza net revenue of $20.5 million, V-Go net revenue of $2.1 million, collaborations and services revenue of $8.0 million and royalties of $0.3 million. Afrezza net revenue increased 13% compared to $18.1 million in the first half of 2021 as a result of price, which included more favorable gross-to-net deductions, higher product demand and a more favorable cartridge mix. Collaborations and services revenue for the first half of 2022 decreased $14.6 million compared to the first half ended June 30, 2021, primarily due to the completion in the second half of 2021 of the R&D services associated with our collaboration with United Therapeutics. Revenue associated with the CSA was deferred until commercial product was manufactured and sold to UT, which occurred in the second quarter of 2022 when $5.9 million of revenue was recognized.
Afrezza gross profit for the first half of 2022 was $14.8 million, compared to $9.3 million in the same period of 2021, an increase of $5.5 million, or 58%, which was driven by an increase in Afrezza sales and a decrease in cost of goods sold. Afrezza’s cost of goods sold for the first half of 2022 decreased by $3.1 million, or 35%, compared to the same period in 2021, primarily as a result of a decrease in manufacturing-related spending, a $2.0 million fee for the amendment of the Insulin Supply Agreement in the prior year period plus a decrease in cost of goods sold due to lower manufacturing-related spend for Afrezza as a result of manufacturing a second product. Afrezza gross margin for the first half of 2022 was 72% compared to 52% for the same period in 2021. V-Go gross profit for the second half of 2022 was $0.8 million which was adversely impacted by the purchase price valuation of inventory.
Cost of revenue – collaborations and services for the first half of 2022 was $17.0 compared to $8.8 million in the same period in 2021, an increase of $8.2 million, primarily due to an increase in manufacturing activities leading up to commercial product manufacturing in the second quarter of 2022.
Research and development expenses for the first half ended June 30, of 2022 were $8.4 million compared to $4.8 million for the same period in 2021. This $3.7 million increase primarily attributable to costs incurred for development activities on our product pipeline and the Afrezza pediatrics clinical study (INHALE-1).
Selling, general and administrative expenses for the first half of 2022 were $46.7 million compared to $37.5 million for same period in 2021. This $9.2 million increase was primarily attributable to a pilot promotional effort aimed at primary care physicians that began in Q4 2021, elimination of the Thyquidity co-promotion (which permitted some expenses associated with the sales force to be recognized as cost of revenue — collaborations and services in 2Q 2021), promotional expenses to support Afrezza and V-Go growth and higher stock-based and other compensation for G&A employees.
For the first half of 2022, the gain on foreign currency translation (for insulin purchase commitments denominated in Euros) was $6.5 million compared to $2.9 million for the same period of 2021. The fluctuation was due to a change in the U.S. dollar to Euro foreign currency exchange rate.
Interest expense on financing liability was $4.8 million for the first half of 2022, representing interest incurred on the November 2021 sale and lease-back of our manufacturing facility in Danbury, CT.
Interest expense on notes for the first half of 2022 was $9.4 million compared to $9.6 million in the same period of 2021.
The net loss for the first half of 2022 was $55.0 million, or $0.22 per share, compared to $48.4 million in the same period of 2021, or $0.20 per share. The $6.6 million increase in the net loss was primarily due to total revenues decreasing $9.8 million, selling, general and administrative expenses increasing $9.2 million and cost of revenue – collaboration and services increasing by $8.2 million partially offset by the loss on extinguishment of debt of $22.1 million in the second quarter of 2021.
Conference Call
MannKind will host a conference call and presentation webcast to discuss these results today at 5:00 p.m. Eastern Time. Those interested in listening to the conference call live via the Internet may do so by visiting the Company’s website at mannkindcorp.com under Events & Presentations. A replay will be available on MannKind's website for 14 days.
About MannKind
MannKind Corporation (Nasdaq: MNKD) focuses on the development and commercialization of innovative therapeutic products and devices to address serious unmet medical needs for those living with endocrine and orphan lung diseases.
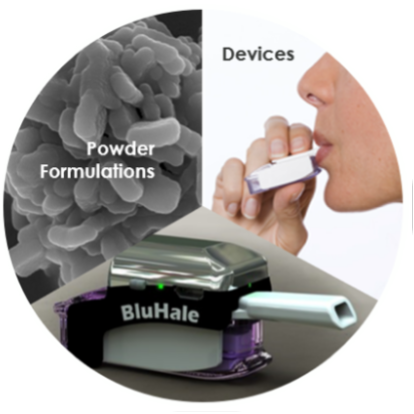
We are committed to using our formulation capabilities and device engineering prowess to lessen the burden of diseases such as diabetes, pulmonary arterial hypertension (PAH) and nontuberculous mycobacterial (NTM) lung disease. Our signature technologies – dry-powder formulations and inhalation devices – offer rapid and convenient delivery of medicines to the deep lung where they can exert an effect locally or enter the systemic circulation.
With a passionate team of Mannitarians collaborating nationwide, we are on a mission to give people control of their health and the freedom to live life.
Please visit mannkindcorp.com to learn more, and follow us on LinkedIn, Facebook, Twitter or Instagram.
Forward-Looking Statements
Statements in this press release that are not statements of historical fact are forward-looking statements that involve risks and uncertainties. These statements include, without limitation, statements regarding the expected sources of revenue and growth opportunities for MannKind. Words such as “believes”, “anticipates”, “plans”, “expects”, “intend”, “will”, “goal”, “potential” and similar expressions are intended to identify forward-looking statements. These forward-looking statements are based upon MannKind’s current expectations. Actual results and the timing of events could differ materially from those anticipated in such forward-looking statements as a result of these risks and uncertainties, which include, without limitation, risks that our products may only achieve a limited degree of commercial success and that manufacturing risks may adversely affect our ability to manufacture our products. These and other are risks detailed in MannKind’s filings with the Securities and Exchange Commission (“SEC”), including under the “Risk Factors” heading of its Annual Report on Form 10-K for the year ended December 31, 2021, filed with the SEC on February 24, 2022, and in its Quarterly Report on Form 10-Q for the quarter ended June 30, 2022, being filed with the SEC later today. You are cautioned not to place undue reliance on these forward-looking statements, which speak only as of the date of this press release. All forward-looking statements are qualified in their entirety by this cautionary statement, and MannKind undertakes no obligation to revise or update any forward-looking statements to reflect events or circumstances after the date of this press release.
TYVASO DPI is a trademark of United Therapeutics Corporation.
AFREZZA, TECHNOSPHERE, MANNKIND, V-GO and the MannKind logo are registered trademarks of MannKind Corporation.
MannKind Contact:
Rose Alinaya, Investor Relations
(818) 661-5000
MANNKIND CORPORATION AND SUBSIDIARY
CONDENSED CONSOLIDATED BALANCE SHEETS
(In thousands, except share and per share data)
| |
June 30, 2022 |
|
|
December 31, 2021 |
|
| ASSETS |
|
|
|
|
|
|
|
| Current assets: |
|
|
|
|
|
|
|
| Cash and cash equivalents |
$ |
35,507 |
|
|
$ |
124,184 |
|
| Short-term investments |
|
118,649 |
|
|
|
79,932 |
|
| Accounts receivable, net |
|
15,030 |
|
|
|
4,739 |
|
| Inventory |
|
20,573 |
|
|
|
7,152 |
|
| Prepaid expenses and other current assets |
|
3,717 |
|
|
|
3,482 |
|
| Total current assets |
|
193,476 |
|
|
|
219,489 |
|
| Property and equipment, net |
|
37,918 |
|
|
|
36,612 |
|
| Goodwill |
|
2,900 |
|
|
|
— |
|
| Other intangible asset |
|
1,400 |
|
|
|
— |
|
| Long-term investments |
|
32,596 |
|
|
|
56,619 |
|
| Other assets |
|
17,507 |
|
|
|
8,441 |
|
| Total assets |
$ |
285,797 |
|
|
$ |
321,161 |
|
| |
|
|
|
|
|
|
|
| LIABILITIES AND STOCKHOLDERS' DEFICIT |
|
|
|
|
|
|
|
| Current liabilities: |
|
|
|
|
|
|
|
| Accounts payable |
$ |
7,823 |
|
|
$ |
6,956 |
|
| Accrued expenses and other current liabilities |
|
33,184 |
|
|
|
27,419 |
|
| Financing liability — current |
|
9,470 |
|
|
|
6,977 |
|
| Deferred revenue — current |
|
1,667 |
|
|
|
827 |
|
| Recognized loss on purchase commitments — current |
|
7,420 |
|
|
|
6,170 |
|
| Total current liabilities |
|
59,564 |
|
|
|
48,349 |
|
| Senior convertible notes |
|
224,670 |
|
|
|
223,944 |
|
| Midcap credit facility |
|
39,047 |
|
|
|
38,833 |
|
| Mann Group convertible note |
|
8,829 |
|
|
|
18,425 |
|
| Accrued interest — promissory notes |
|
86 |
|
|
|
404 |
|
| Financing liability — long term |
|
94,447 |
|
|
|
93,525 |
|
| Recognized loss on purchase commitments — long term |
|
65,996 |
|
|
|
76,659 |
|
| Operating lease liability |
|
5,928 |
|
|
|
1,040 |
|
| Deferred revenue — long term |
|
29,762 |
|
|
|
19,543 |
|
| Milestone liabilities |
|
4,524 |
|
|
|
4,838 |
|
| Deposits from customer |
|
— |
|
|
|
4,950 |
|
| Total liabilities |
|
532,853 |
|
|
|
530,510 |
|
| Stockholders' deficit: |
|
|
|
|
|
|
|
| Undesignated preferred stock, $0.01 par value — 10,000,000 shares authorized; no shares issued or outstanding as of June 30, 2022 and December 31, 2021 |
|
— |
|
|
|
— |
|
| Common stock, $0.01 par value - 400,000,000 shares authorized, 257,276,847 and 251,477,562 shares issued and outstanding at June 30, 2022 and December 31, 2021, respectively |
|
2,573 |
|
|
|
2,515 |
|
| Additional paid-in capital |
|
2,936,667 |
|
|
|
2,918,205 |
|
| Accumulated other comprehensive loss |
|
(1,206 |
) |
|
|
— |
|
| Accumulated deficit |
|
(3,185,090 |
) |
|
|
(3,130,069 |
) |
| Total stockholders' deficit |
|
(247,056 |
) |
|
|
(209,349 |
) |
| Total liabilities and stockholders' deficit |
$ |
285,797 |
|
|
$ |
321,161 |
|
MANNKIND CORPORATION AND SUBSIDIARY
CONDENSED CONSOLIDATED STATEMENTS OF OPERATIONS
(In thousands, except per share data)
| |
Three Months Ended
June 30, |
|
|
Six Months Ended
June 30, |
|
| |
2022 |
|
|
2021 |
|
|
2022 |
|
|
2021 |
|
| Revenues: |
|
|
|
|
|
|
|
|
|
|
|
|
|
|
|
| Net revenue — commercial product sales |
$ |
12,722 |
|
|
$ |
9,976 |
|
|
$ |
22,548 |
|
|
$ |
18,075 |
|
| Revenue — collaborations and services |
|
5,868 |
|
|
|
13,304 |
|
|
|
8,034 |
|
|
|
22,641 |
|
| Royalties |
|
304 |
|
|
|
— |
|
|
|
304 |
|
|
|
— |
|
| Total revenues |
|
18,894 |
|
|
|
23,280 |
|
|
|
30,886 |
|
|
|
40,716 |
|
| Expenses: |
|
|
|
|
|
|
|
|
|
|
|
|
|
|
|
| Cost of goods sold |
|
4,617 |
|
|
|
4,411 |
|
|
|
6,901 |
|
|
|
8,726 |
|
| Cost of revenue — collaborations and services |
|
8,298 |
|
|
|
5,515 |
|
|
|
17,012 |
|
|
|
8,810 |
|
| Research and development |
|
4,893 |
|
|
|
2,329 |
|
|
|
8,429 |
|
|
|
4,771 |
|
| Selling, general and administrative |
|
26,043 |
|
|
|
20,056 |
|
|
|
46,740 |
|
|
|
37,469 |
|
| (Gain) loss on foreign currency translation |
|
(4,503 |
) |
|
|
903 |
|
|
|
(6,486 |
) |
|
|
(2,935 |
) |
| Loss on purchase commitments |
|
— |
|
|
|
339 |
|
|
|
— |
|
|
|
339 |
|
| Total expenses |
|
39,348 |
|
|
|
33,553 |
|
|
|
72,596 |
|
|
|
57,180 |
|
| Loss from operations |
|
(20,454 |
) |
|
|
(10,273 |
) |
|
|
(41,710 |
) |
|
|
(16,464 |
) |
| Other (expense) income: |
|
|
|
|
|
|
|
|
|
|
|
|
|
|
|
| Interest income, net |
|
516 |
|
|
|
25 |
|
|
|
893 |
|
|
|
28 |
|
| Interest expense on financing liability |
|
(2,443 |
) |
|
|
— |
|
|
|
(4,814 |
) |
|
|
— |
|
| Interest expense on notes |
|
(6,642 |
) |
|
|
(3,180 |
) |
|
|
(9,390 |
) |
|
|
(9,632 |
) |
| Loss on extinguishment of debt, net |
|
— |
|
|
|
(22,130 |
) |
|
|
— |
|
|
|
(22,130 |
) |
| Other expense |
|
— |
|
|
|
35 |
|
|
|
— |
|
|
|
(241 |
) |
| Total other expense |
|
(8,569 |
) |
|
|
(25,250 |
) |
|
|
(13,311 |
) |
|
|
(31,975 |
) |
| Loss before provision for income taxes |
|
(29,023 |
) |
|
|
(35,523 |
) |
|
|
(55,021 |
) |
|
|
(48,439 |
) |
| Provision for income taxes |
|
— |
|
|
|
— |
|
|
|
— |
|
|
|
— |
|
| Net loss |
$ |
(29,023 |
) |
|
$ |
(35,523 |
) |
|
$ |
(55,021 |
) |
|
$ |
(48,439 |
) |
| Net loss per share - basic and diluted |
$ |
(0.11 |
) |
|
$ |
(0.14 |
) |
|
$ |
(0.22 |
) |
|
$ |
(0.20 |
) |
| Shares used to compute net loss per share - basic and diluted |
|
253,644 |
|
|
|
249,295 |
|
|
|
252,775 |
|
|
|
247,970 |
|


Source: MannKind